A browser DevTools panel for React pages
See how a React page is composed.
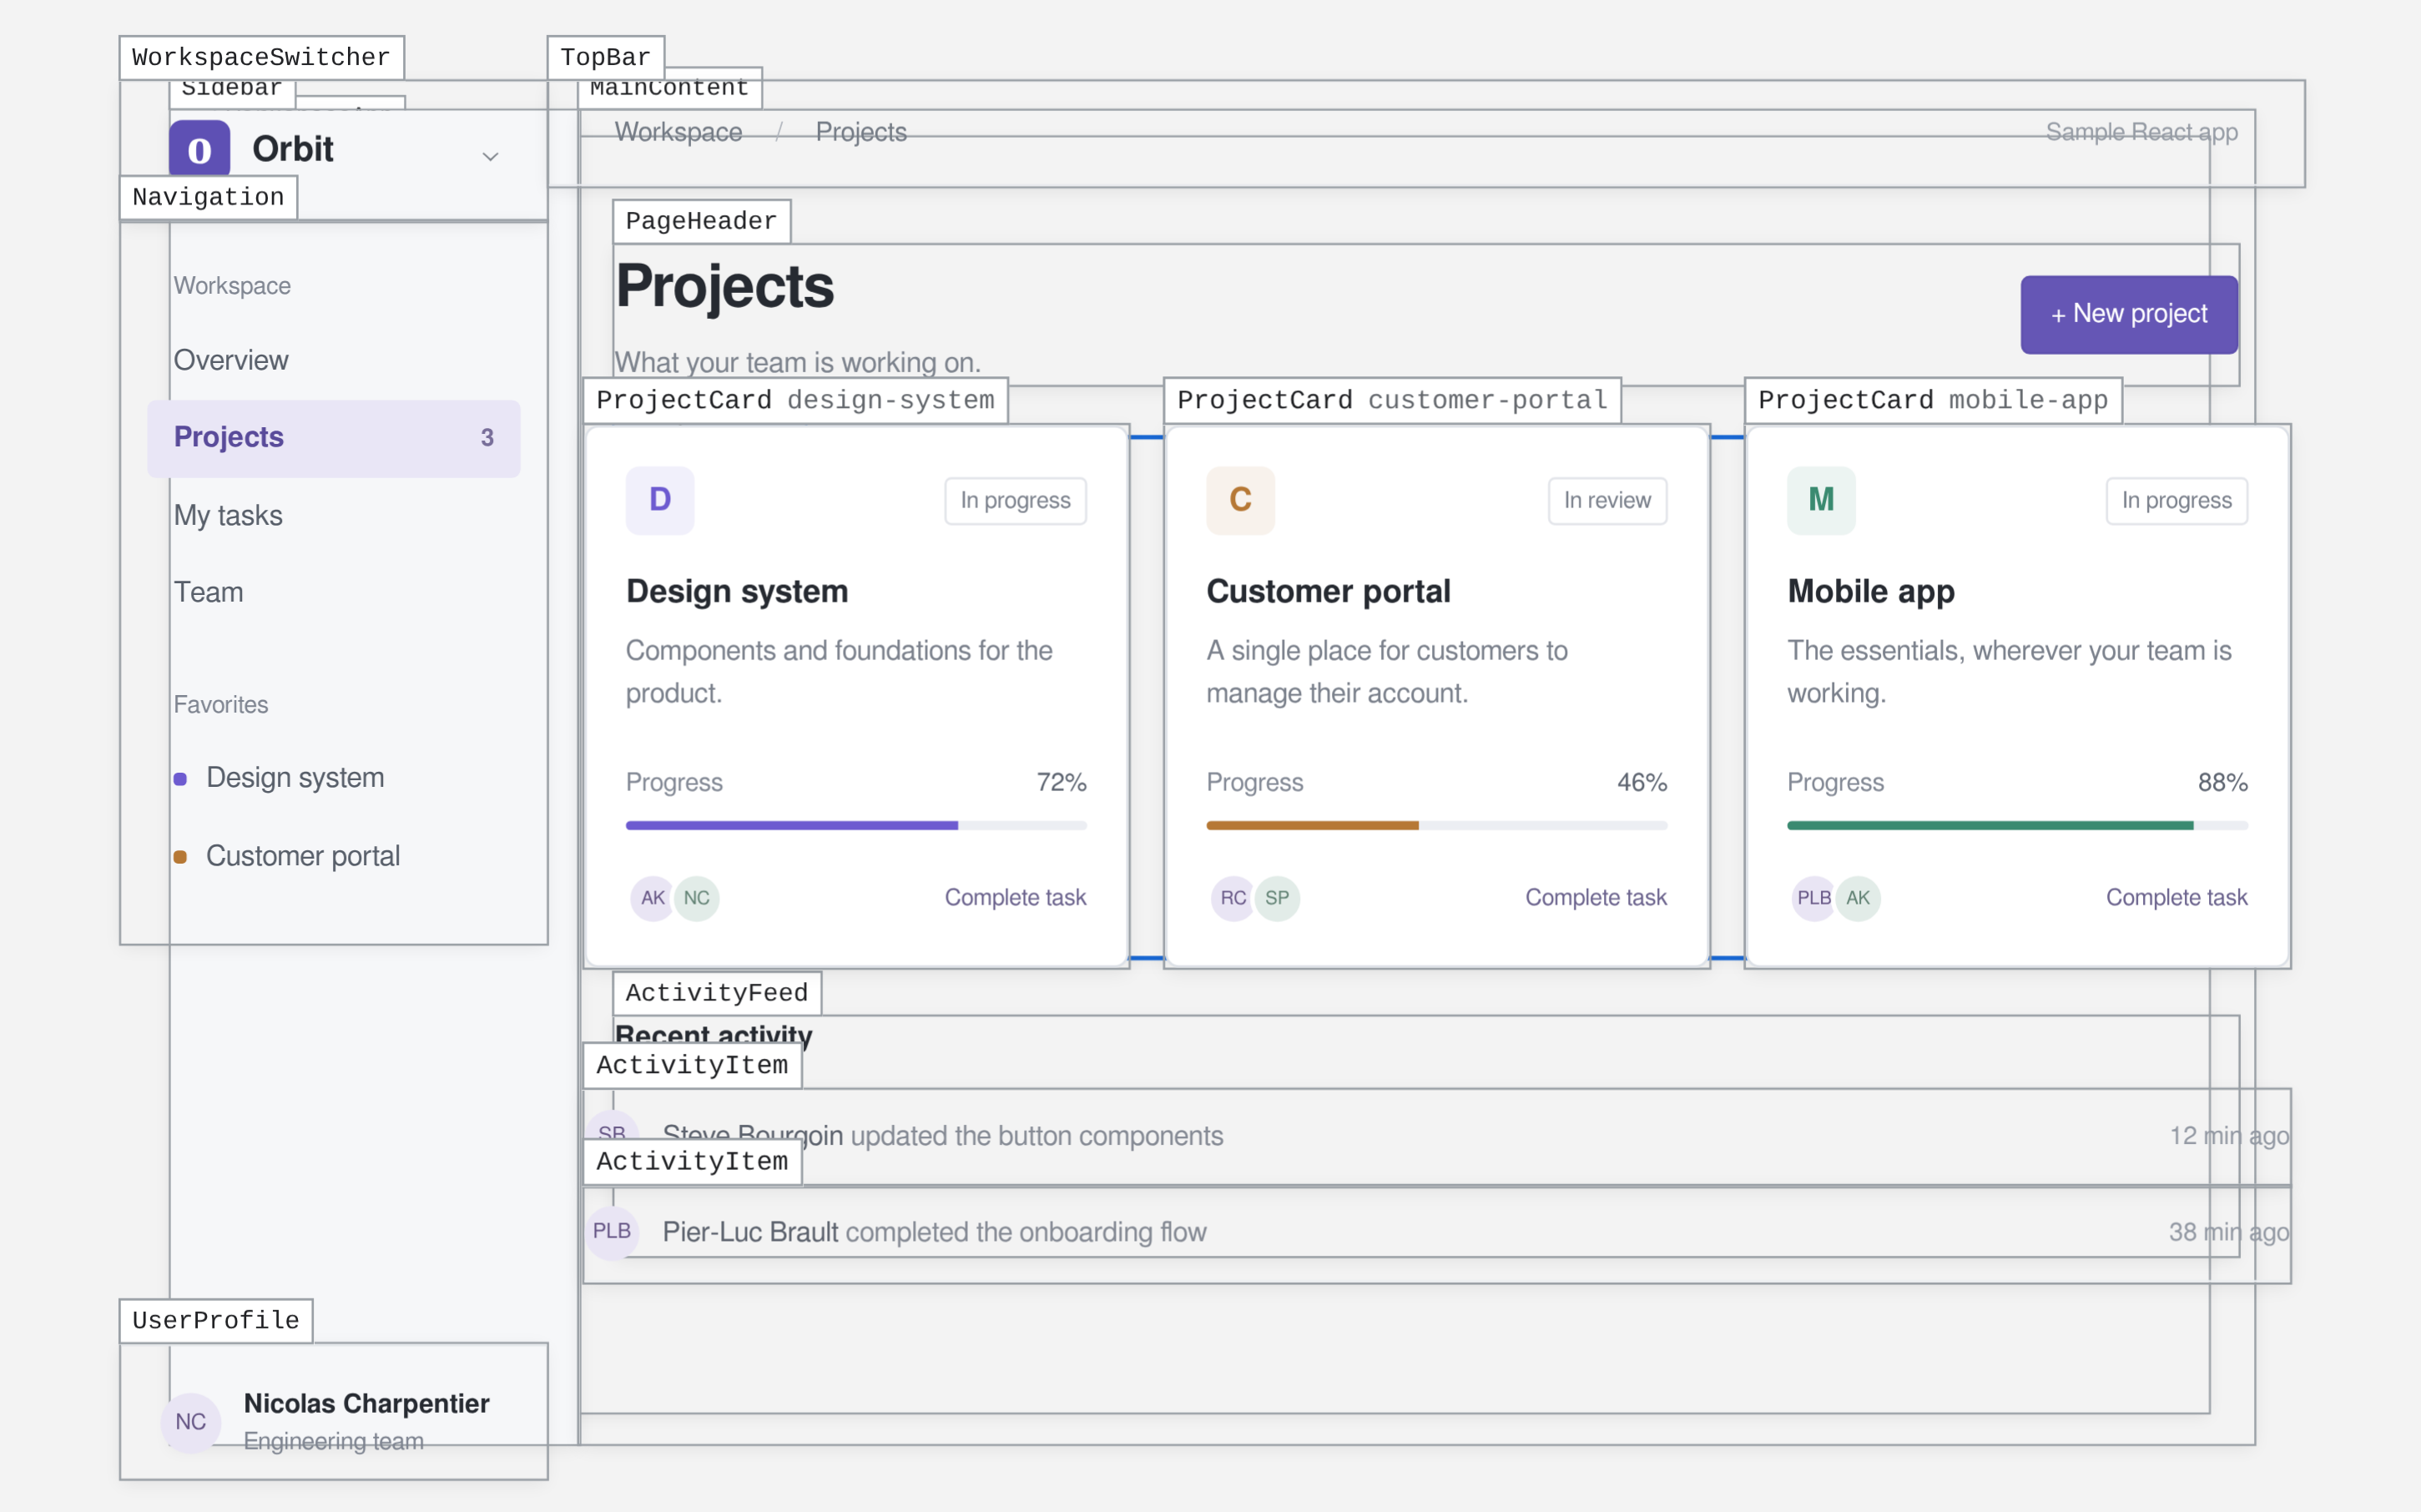
React Anatomy is a browser extension that adds an Anatomy panel to your browser’s developer tools. It connects the page in front of you to the components React rendered for it: separate the page into 3D layers, follow the real component tree, and read the props behind what you see.
Click the Anatomy tab to see how this page is composed.
Install the extension
Compatibility notes


Firefox Add-ons
 Add to Firefox
Where it comes from
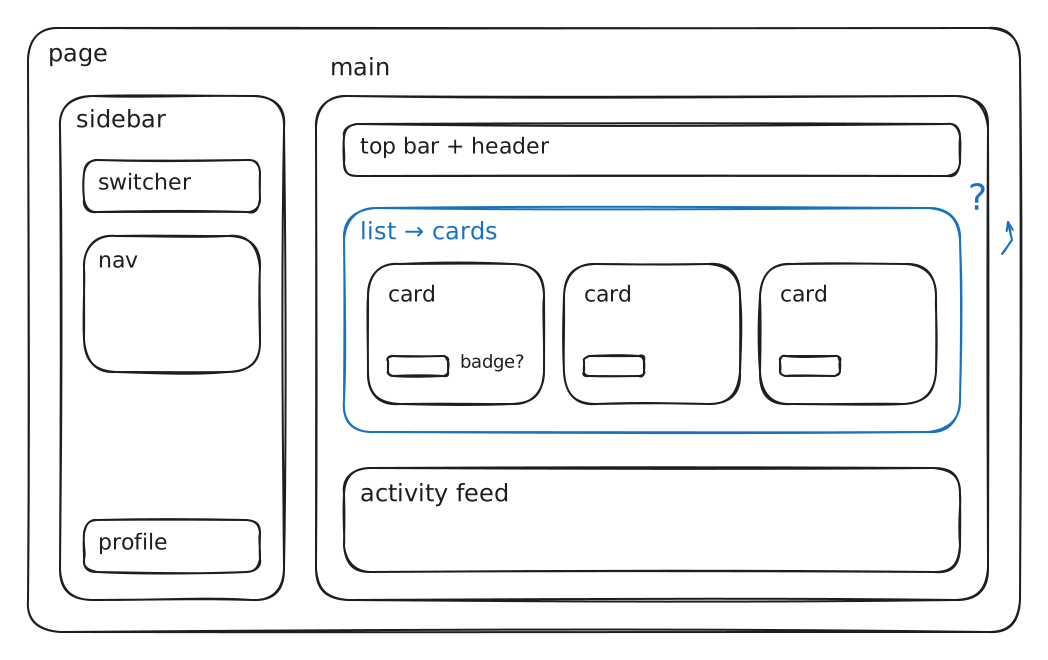
The diagram I used to draw by hand.
To understand a screen, or to explain a change in a pull request, I would open Excalidraw and draw boxes: this region is the sidebar, these cards come from a list, the badge lives inside each card. It took time, and it was my reading of the code, not what React actually rendered.
React Anatomy builds that picture from the running page. The layers come from what is on screen; the names and the nesting come from React itself.
When it helps
For the moments you need to understand a page,
not just change it.
- 01
Find your way in an unfamiliar layout.
New codebase, or a page someone else built? Pick what you see and learn which component renders it, and where it sits.
Understand a page - 02
Learn how React composes a page.
See parents, children and repeated components as one structure, and follow the props a list hands to each of its items.
Follow the data - 03
Investigate something unexpected.
A region in the wrong place, or a value that looks off? Find the component that rendered it and read the props it actually received.
Inspect props - 04
Explain a change to a reviewer.
Focus the part you changed, take a screenshot, and describe the structure in your pull request, next to the diff.
Explain a change - 05
Read what an agent built.
Before you take ownership of a page an AI agent wrote, look at what it rendered: which components, how deeply nested, and with which props.
Read generated code - A note on scope
React Anatomy shows structure; it doesn’t grade it. It is an inspector, not a code reviewer. Whether a structure is right stays your call.
What you’re looking at
The tree React rendered.
Not your import graph.
Anatomy reads the components React rendered for this page, right now. A component that is imported but not on screen doesn’t appear. One rendered three times appears three times, each with its own props. Files, imports and dependencies are a different map.
The 3D view starts from the shape of the page. Auto depth separates each visible region, and wrappers with identical output share a plane. Every captured component stays in the tree.
How layers and depth work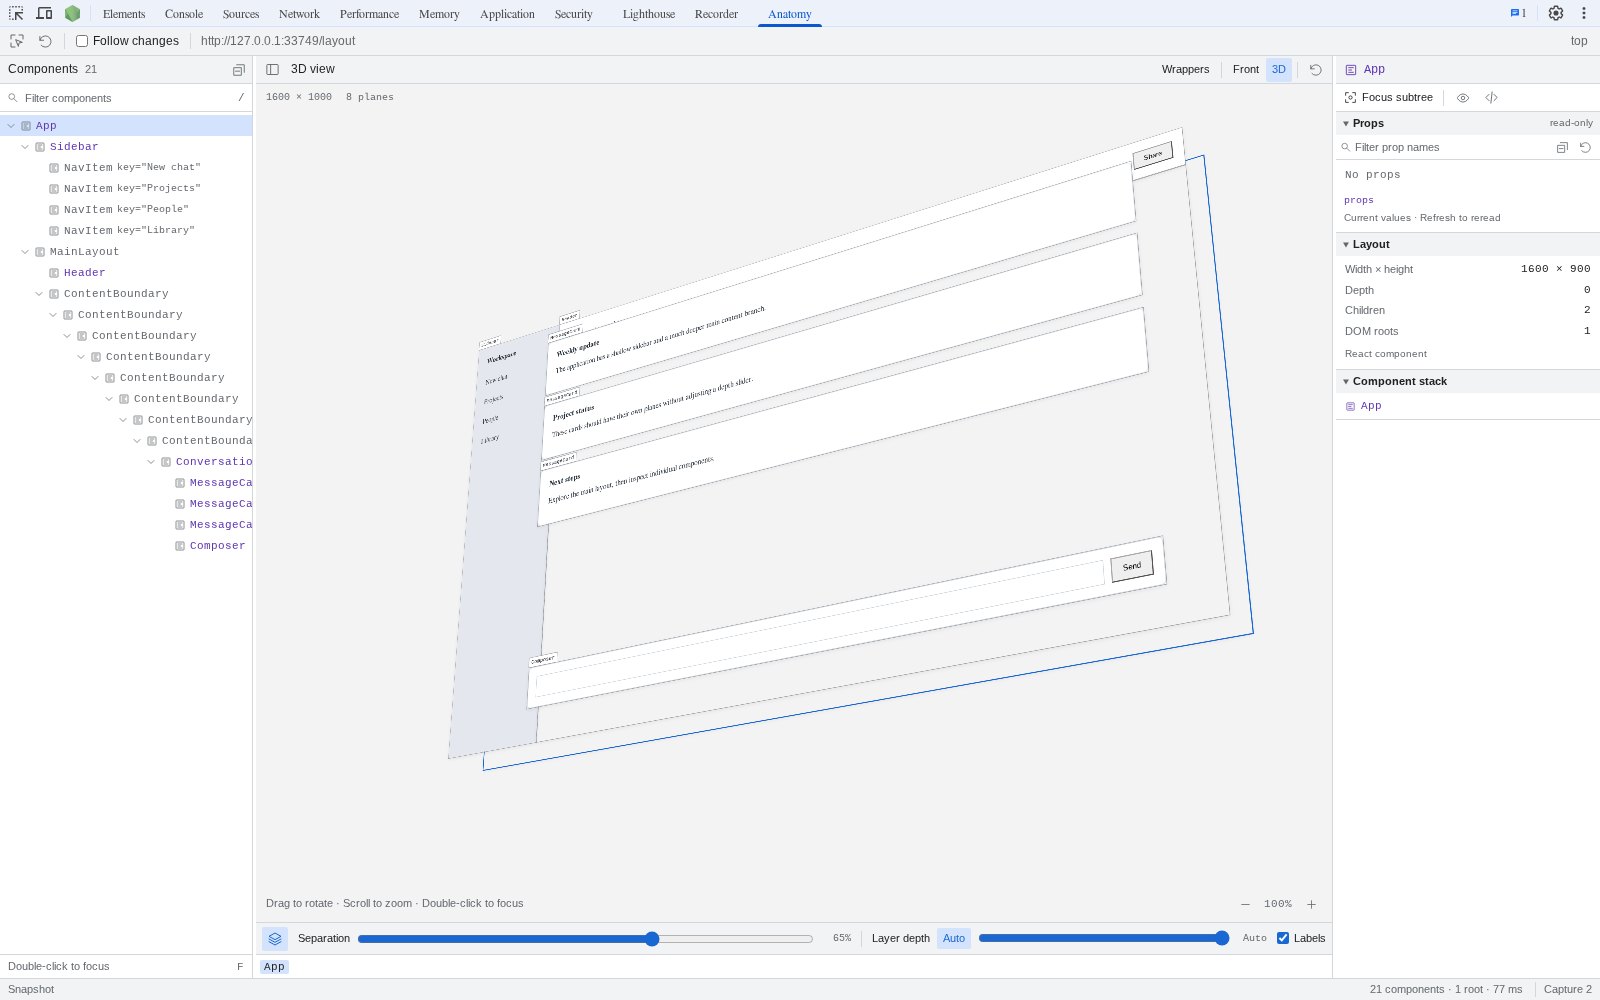
A tool in the making
Built for understanding.
React Anatomy reads a running React app, with no package or code changes required. Inspection happens in your browser.
It uses React’s private internals, so compatibility and visual fidelity can vary. The docs explain what it can see today.