
Understand a page
Use this when you open a page you don’t know well: a new codebase, someone else’s feature, or a layout you are learning from. The goal is a picture of how the page is composed that you could sketch on a whiteboard.
Open DevTools on the page and choose Anatomy, possibly under the » menu. The first capture happens automatically. Undock DevTools if you need more room.
Start from what you see
Section titled “Start from what you see”You usually know what something looks like before you know what it is called.
- Choose Pick on page (or press C) and click the region you are curious about in your app.
- Anatomy selects the closest component that rendered what you clicked. Its row is selected in the tree and its plane in the 3D view.
- Read the Component stack in the inspector. It lists the components above the selection, so you can see where it sits: for example a card, inside a list, inside the main content.
- Use Highlight on page to confirm the region in your app, or Reveal in Elements to see its DOM output.
If you already know a name, press / and filter the tree instead.
Read the outline
Section titled “Read the outline”Collapse the tree to its top levels, then open one branch at a time. The first two or three levels usually describe the page’s regions — a sidebar, a header, a main area — and deeper levels describe what those regions are made of.
Keys appear next to repeated components. Three ProjectCard rows with keys tell you a list rendered one card per item.
See the layers
Section titled “See the layers”Explode view separates the page into planes. Keep Labels on to see component names on the planes (they keep a readable size when the view zooms out), drag to orbit, and use Front to look straight at the page again.
Layer depth starts in Auto, which gives each visible region its own layers even when one branch is much deeper than another. Wrappers that render identical output share a plane, but they keep their own tree rows.
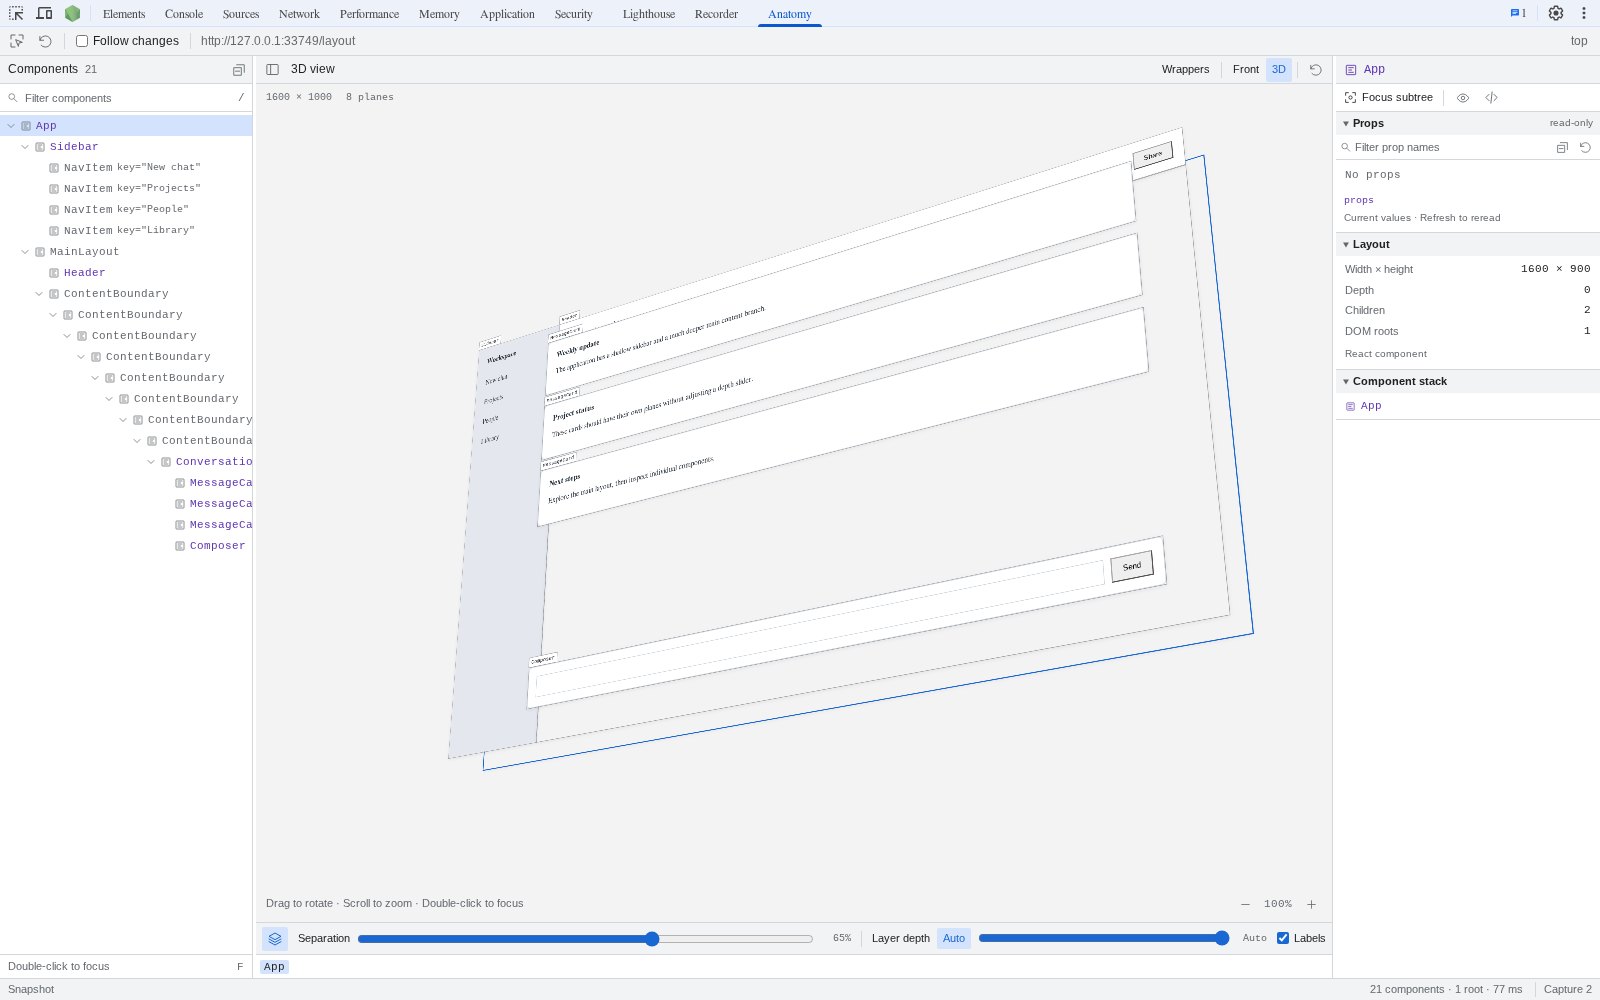
The tree shows a deep chain of containers; Auto depth still gives the visible regions their own layers. Select the image to open it at full size.
Zoom into one part
Section titled “Zoom into one part”Select a component and choose Focus subtree, double-click it, or press F. The scene shows only that component and its descendants, which makes small children — a badge, a progress bar — easy to see. The breadcrumbs above the scene show where the focused part sits; Whole page or Escape returns to the overview.
Follow the data
Section titled “Follow the data”Structure tells you who renders whom; props tell you what each one received.
Select a parent, then one of its children, and compare their Props. A list usually receives an array and hands one item to each child; a card might receive a project object and a callback. Expand objects and arrays to read nested values as they are right now.
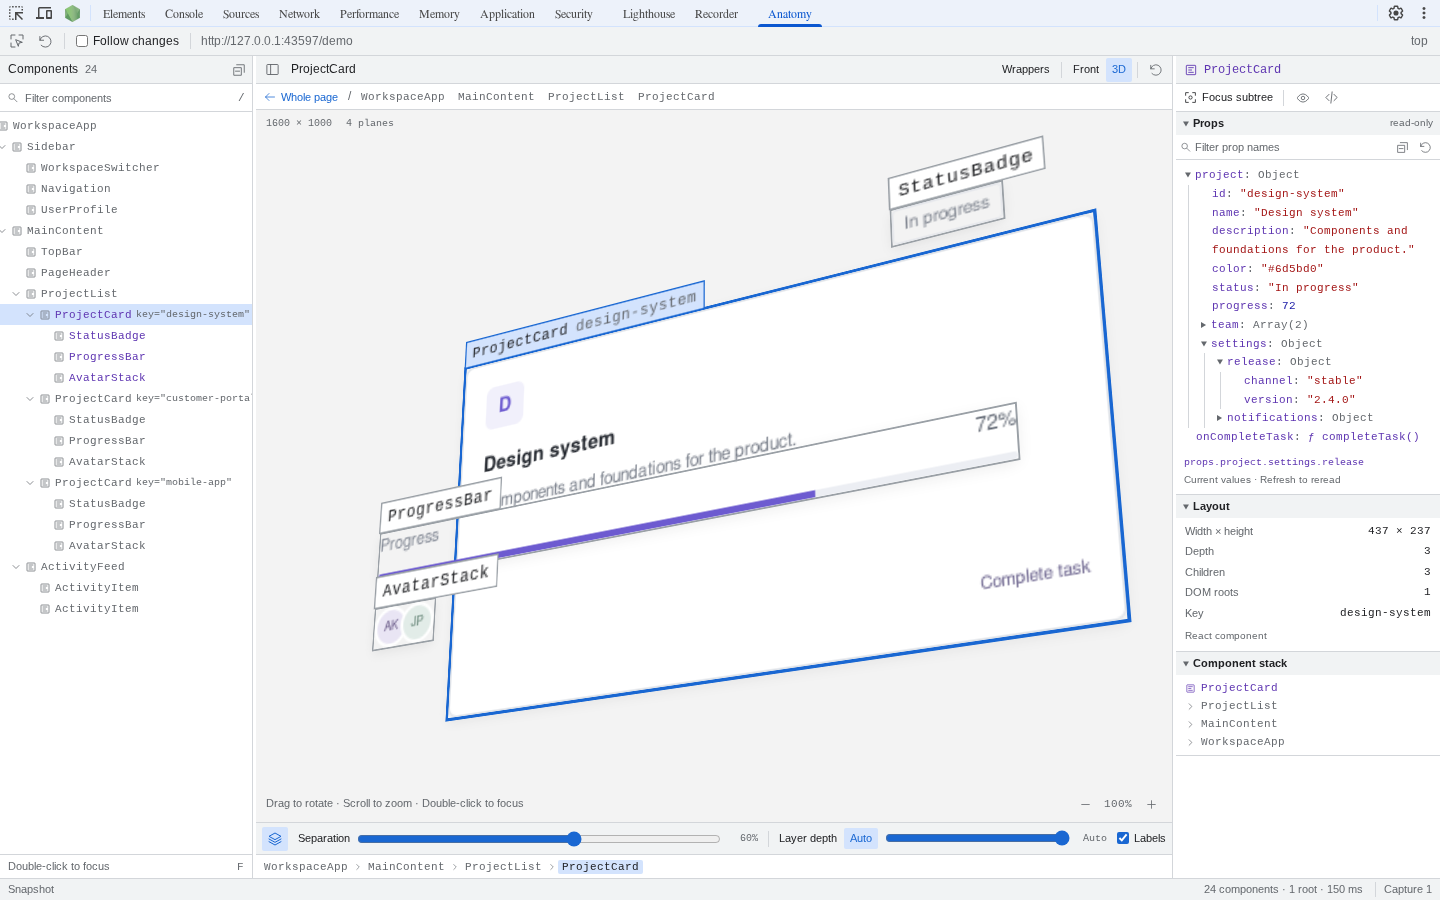
A card’s live props, expanded down to project.settings.release. Select the image to open it at full size.
Props are read-only and current: interact with the page, then choose Refresh props to see new values. See Props inspector for what is and isn’t evaluated.
Try it on the example
Section titled “Try it on the example”The interactive example runs the real inspector against a small sample app. Open Anatomy, explode the page, pick a project card, and follow its props — no extension needed.